Additional Articles
Here are more interesting articles on FreeBSD, ZFS that you may find useful:
- The Real Cost of Technology Dependence: Building Independence with Open-Source Storage
- Designing OpenZFS Storage for Independence: Pool Architecture, Failure Domains, and Migration Paths
- ZFS Fast Dedup for Proxmox VE 9.x: Technical Implementation Guide
- ARC and L2ARC Sizing on Proxmox
- Pool and VDEV Topology for Proxmox Workloads
Learn what's happening in your FreeBSD system and alter the way the system behaves in real time
In Deep Diving Into the Strengths of FreeBSD we provided a high-level overview of some of the many reasons to choose FreeBSD. Now, let’s take a look at FreeBSD from a performance observability perspective.
By observability, we mean the ability to observe what is happening on a live system—and in many cases, to alter the behavior of that system in real-time.
There is a myriad of performance analysis tools available for purchase, but you cannot understate the value of tools that are specifically built for and with an operating system: tools which understand and are built into the operating system’s kernel structures.
Pretty much everything a FreeBSD system does, right down to the system-call level, is tracked. Each utility on the system gathers what it needs from this pool of information: for example, the ifconfig and zpool status commands query it.
You too can gather the information you need in order to get the most out of your system, determine your operational baselines, and find and resolve performance bottlenecks.
A few years ago, Brendan Gregg gave an excellent talk on FreeBSD performance analysis (the video and slides of the presentation are available on his blog). In the following image, he provides an overview of FreeBSD’s system components and which built-in observability tools can be used for those components:
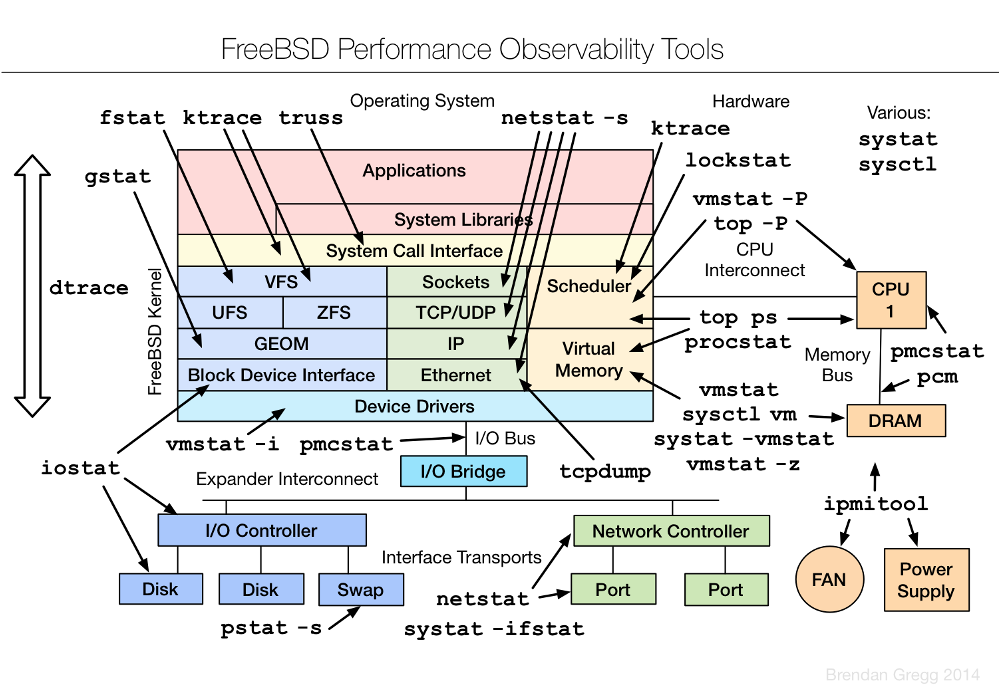
You probably already recognize some of these tools. We obviously can’t cover them all in one article. Instead, let’s concentrate on the two which provide observability into the widest variety of subsystems: sysctl and dtrace.
sysctl(8)
The sysctl(8) command is used to get (view) or set (modify) information on a running system. This command provides observability into literally thousands of different elements of a system’s running state.
To get an idea of what type of information is available, try piping sysctl -a | more. But when you do, be prepared to scroll for some time—there are many, many observable elements!
net.inet.tcp.sendspace: 32768
This Management Information Base (MIB) can be read as: a network facility, in the Internet protocol family, specifically the TCP protocol, the maximum space for the send window component, with a current value of 32768 bytes.
There are MIBs for various kernel (kern) subsystems (such as ipc, sched, geom, and cam), networking (IP, ICMP, TCP, UDP, SCTP, Ipsec, Ethernet, IPv6, wireless, BPF), hardware (ACPI, USB, sound, PCI), devices, security, and so on.
If you’re interested in a particular subsystem, try listing just that portion of the MIB. For example, to see all of the TCP MIBs:
sysctl net.inet.tcp |moreIf you find an MIB that sounds interesting, where do you get more information about it? Many MIBs provide a brief description. Use -d and specify the full MIB name:
sysctl -d net.inet.tcp.sendspace
net.inet.tcp.sendspace: Initial send socket buffer size
Many FreeBSD man pages, software installation messages, and sections of the FreeBSD Handbook provide information about sysctl parameters suited to the application or subsystem being discussed. The tuning(7) man page provides an introduction to using sysctl to tune a FreeBSD system. In addition, an Internet search of a specific MIB will often yield useful results.
While the root user can modify many MIBs on the fly, you never want to change a value on a production system until that setting has been thoroughly tested in a staging environment.
Do not make up values or randomly try values you found somewhere on the Internet. Research is time well spent to understand what the MIB does and to watch the performance impact over time for a new testing value. When testing application performance, see if any values are recommended by the application's documentation.
Finally, if you do find a new value that has the desired performance impact and you intend to add it to /etc/sysctl.conf so that the new value survives a reboot, be very careful when editing this file—a typo could prevent the system from booting!
You can use single-user mode to fix any typo you do make, but delaying the boot of a system is never desirable.
dtrace(1)
DTrace (Dynamic Tracing) is a profiling tool for locating performance bottlenecks and debugging unexpected behavior in both the FreeBSD kernel and applications running on a FreeBSD system.
Some FreeBSD ports, such as PostgreSQL, Memcached, Erlang, Tcl, Perl, PHP, lldpd, and Node.js provide a DTRACE compile option for enabling DTrace profiling for that application.
DTrace is an ideal tool for performance analysis as it has no system overhead when not in use—and when in use, its low impact on system performance means that it can be used to provide observability on production systems performing real tasks.
In DTrace terminology, a provider is a specific kernel subsystem which provides a series of probes, or information that can be gathered. An administrator can use a script, written in the D language, to analyze this information.
On FreeBSD systems, a few scripts come with the operating system and are located in /usr/share/dtrace/. The OpenDTrace Toolkit is the best source for getting additional DTrace scripts, docs, and examples.
Did you know?
Getting your ZFS infrastructure up to date has never been easier!
Our team provides consistent, expert advice tailored to your business.
DTrace scripts consist of a list of one or more probes, where each probe is associated with an action. Whenever the condition for a probe is met, the associated action is executed. For example, an action may occur when a file is opened, a process is started, or a line of code is executed. The action might be to log some information or to modify context variables.
Only the root user can use DTrace on FreeBSD. First, ensure that the DTrace kernel module is loaded:
kldload dtraceallTo see which probes are available on the system, you could run this command, though it will list tens of thousands of probes!
dtrace -l | moreTo just list the providers, in order to see which subsystems are traceable, try this command. Note that this command uses single quotes, not backticks:
dtrace -l | sed 1d | awk '{print $2}' | sort -uThe available providers may vary, depending upon the FreeBSD version and which kernel modules have been loaded. The most commonly available ones are listed in the table, along with a brief description of the subsystem.
DTrace Providers
Provider Name	Description
dtmalloc	Kernel memory management
fbt	Function boundary tracing (kernel functions)
io	Disk I/O
ip	IP buffers
lockstat	Locks
mac	Mandatory Access Control
mac_framework	Mandatory Access Control
nfscl	NFSv3 and NFSv4 calls
priv	Kernel privilege
proc	Process operations
profile	Time-based interrupt firing every fixed, specified time interval
racct	Resource limits
sched	CPU scheduling
sctp	SCTP values
sdt	Statically defined tracing (ZFS ARC)
syscall	System calls
tcp	TCP connections
udp	UDP buffers
udplite	UDP-Lite buffers
vfs	Filesystem routines
vm	Virtual memory
vnet	Network virtualization
xbb	Xen block backend
FreeBSD obviously has some interesting providers and a lot of probes that can be observed, but how do you use them?
In FreeBSD 11.2 and later, the dwatch(1) utility can be used for initial observability, no scripting required. For example, to monitor current TCP activity, try:
dwatch -X tcp
INFO Sourcing tcp profile [found in /usr/libexec/dwatch]
INFO Watching 'tcp:::accept-established, tcp:::accept-refused, tcp:::connect-established, tcp:::connect-refused, tcp:::connect-request, tcp:::receive, tcp:::send, tcp:::state-change' …
2021 May 28 14:40:19 0.0 kernel[0]: 192.168.1.124:34058 <- 157.240.18.15:443 103 bytes
2021 May 28 14:40:19 1001.1001 firefox[1215]: 192.168.1.124:34058 -> 157.240.18.15:443 63 bytes
This command will watch forever until you CTRL^c it. In this example, it looks like someone left a Facebook tab open in Firefox...
A more interesting example looks for processes as they open files:
Did you know?
Want to learn more about ZFS? We consistently write about the awesome powers of OpenZFS in our article series.
dwatch -X open
INFO Sourcing open profile [found in /usr/libexec/dwatch]
INFO Watching 'syscall::open:entry, syscall::openat:entry' ...
2021 May 28 14:51:21 1001.1001 konsole[1682]: /etc/pwd.db
2021 May 28 14:51:21 0.0 dtrace[44567]: /etc/localtime
2021 May 28 14:51:21 0.0 dtrace[44567]: /usr/share/zoneinfo/posixrules
2021 May 28 14:51:44 0.0 upowerd[1030]: /dev/acpi
2021 May 28 14:52:00 0.0 cron[918]: /etc/cron.d
There are many examples available to try. A good place to find examples is the dwatch man page and the FreeBSD DTrace One-Liners.
These resources are useful if you want to try some of the available scripts or try creating your own scripts with the D language:
- The “DTrace on FreeBSD” page links to a tutorial, the page of handy one-liners, examples, how to add probes to the kernel, and links to useful external resources: https://wiki.freebsd.org/DTrace/
- The “DTrace Guide” has everything you need to know about the D language: https://illumos.org/books/dtrace/preface.html#preface
- The “DTrace User Guide” has many examples of using DTrace: http://docs.oracle.com/cd/E18752_01/html/819-5488/toc.html
- Brendan Gregg’s “FreeBSD Performance Checklist” provides a great summary for identifying common bottlenecks and errors: http://www.brendangregg.com/USEmethod/use-freebsd.htm
Conclusion
FreeBSD provides an outstanding number of observability points—with a bit of digging, it should be possible to pin-point the cause of any bottleneck or performance issue. The team at Klara is available if you need help determining which probes to observe, analyzing your results, or recommendations on which sysctl MIBs to tune.
For more insights from our hands-on work with production systems, check out What We've Learned Supporting FreeBSD in Production.

Dru Lavigne
Dru Lavigne is a retired network and systems administrator, IT instructor, author, and international speaker. Dru is author of BSD Hacks, The Best of FreeBSD Basics, and The Definitive Guide to PC-BSD.
Learn About Klara


