


Today, instead of talking about the things we can do with ZFS, let’s talk about OpenZFS monitoring and observability— how we can measure it, and make sure it’s functioning properly. We’ll start off by discussing manual methods to look into ZFS’ current condition, and then move on to ways to automate them.
Scrubs, zpool status, and you
One of the most important tools for ensuring a pool’s health is the scrub, which can be manually initiated with the zpool scrub command. If you’ve cleverly named your pool “poolname,” the command is zpool scrub poolname and this will kick off a scrub in the background.
In the simplest terms, zpool scrub tells OpenZFS “I want you to read every single allocated block in this pool, compare it to its checksum, and let me know if you find any errors, whether validation or hardware.”
Although you can kick off a scrub manually, modern OpenZFS installs a cron job or systemd timer to automatically begin once per month. Let’s examine that cron job, as installed by default on this Ubuntu 24.04 LTS server:
root@elided-prod0:/# cat /etc/cron.d/zfsutils-linux
PATH=/usr/local/sbin:/usr/local/bin:/sbin:/bin:/usr/sbin:/usr/bin

# TRIM the first Sunday of every month.
24 0 1-7 * * root if [ $(date +\%w) -eq 0 ] && [ -x /usr/lib/zfs-linux/trim ]; then /usr/lib/zfs-linux/trim; fi

# Scrub the second Sunday of every month.
24 0 8-14 * * root if [ $(date +\%w) -eq 0 ] && [ -x /usr/lib/zfs-linux/scrub ]; then /usr/lib/zfs-linux/scrub; fi
By itself, a scrub operation–whether begun manually or automatically–doesn’t produce any output. Instead, it updates the data you’ll receive when you run zpool status:
root@elided-prod0:/# zpool status
  pool: data
 state: ONLINE
  scan: scrub repaired 0B in 03:21:10 with 0 errors on Sun Jan 11 03:45:11 2026
config:

NAME                              STATE     READ WRITE CKSUM
data                              ONLINE       0     0     0
  mirror-0                        ONLINE       0     0     0
    wwn-0x50026b7686a6546e-part2  ONLINE       0     0     0
    wwn-0x50026b7686a654c8-part2  ONLINE       0     0     0
  mirror-1                        ONLINE       0     0     0
    wwn-0x50026b7686a654be-part2  ONLINE       0     0     0
    wwn-0x50026b7686a65516-part2  ONLINE       0     0     0
  mirror-2                        ONLINE       0     0     0
    wwn-0x50026b7686a6559b-part2  ONLINE       0     0     0
    wwn-0x50026b7686a65456-part2  ONLINE       0     0     0
errors: No known data errors
As we can see, this pool completed its most recent automated scrub in three hours and twenty-one minutes, finding no errors. But what if it had found errors? Let’s talk about the READ, WRITE, and CKSUM counters.
Every error of the type labeled will increment the counter for that vdev and/or individual drive, as appropriate. The cksum column tells you when OpenZFS finds an allocated block whose contents don’t match its validation hash (checksum), the read column counts hard Read I/O errors, and the write column counts hard Write I/O errors.
Each error found may affect only one drive, or it might affect the entire vdev. This pool is built of two-wide mirror vdevs–so if a cksum error is found on disk 546e but not on disk 54c8 above, we’ll see a single CKSUM in 546e’s column, but none in either 54c8’s or mirror-0’s, because the scrub corrects the error on 546e from the copy of it on 54c8, and Bob’s your uncle.
But what if 54c8 was unavailable? With no source of redundancy to reconstruct or replace the corrupt block on 546e, that block cannot be corrected–and so zpool status will show us that 54c8 is missing, and that both 546e and mirror-0 each have 1 cksum error.
The read and write errors are a bit simpler: they count the same kind of hardware I/O errors that any filesystem might encounter. If you see read or write errors, that’s a certain indication of a hardware problem–which might be in the drives themselves, their cabling, their controller, or in some cases even the system’s power supply.
cksum errors may be caused by any of the hardware failures listed above, or by bad RAM or even a bad CPU. Technically, you could get a spurious hardware I/O error from bad RAM or CPU, but it’s vastly unlikely–CKSUMs or the entire system crashing and rebooting are far more likely results of RAM or CPU problems.
Periodically hitting the command line and checking zpool statusmanually is the very bare minimum in terms of observation and monitoring–if you don’t do at least that much, you can wind up accumulating literally thousands of errors or even multiple entirely failed drives before a pool finally dies, with no idea that anything is going wrong until your data is gone forever. (You are backing up… right?)
Pool health monitoring is a foundational part of OpenZFS monitoring and observability— it tells us whether we can safely store and retrieve data, but doesn't tell us whether that data is actually being protected over time. A pool can be perfectly healthy while still leaving you exposed if snapshots aren't being created, retained and replicated as intended. To close that gap, we need to observe not just the state of the storage, but the behavior of our snapshot policies themselves.
Automated health monitoring
Remember zpool status? That tool is the source of truth when you need to know what’s going on with your pool, but it can be a bit interesting to interpret programmatically. You need to monitor all three error columns for all vdevs and all drives, and you need to monitor for entirely missing drives (which don’t show error columns at all).
Once you’ve parsed all of that, you need to decide what status all of that information represents. This is the basis of pretty much all monitoring and alerting: you pick a metric, in this case pool health, and in addition to any raw or descriptive values you might pull for display, you need to know whether it means that this metric is in ok, warn, or crit condition.
While you certainly can do all this manually, here’s the part where I recommend Sanoid again, because Sanoid can handle all of this for you right out of the box. First, let’s look at a healthy pool:
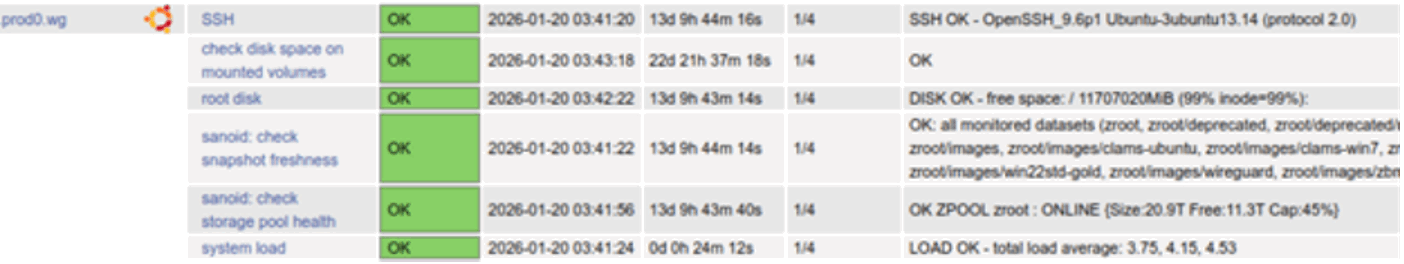
root@elided-prod0:/# sanoid --monitor-health
OK ZPOOL zroot : ONLINE {Size:20.9T Free:11.3T Cap:45%}
Now, let’s try this on the workstation I’m writing this article on, which happens to have a currently-degraded pool onboard:
root@banshee:/# sanoid --monitor-health
*** WARNING *** OK ZPOOL banshee : ONLINE {Size:1.77T Free:885G Cap:51%} , WARNING ZPOOL data : DEGRADED {Size:7.27T Free:4.01T Cap:44%} <mirror-0:DEGRADED> 14006910756957605712:UNAVAIL
This is an interesting one, because this system has two pools in it: banshee, and data. The banshee pool is currently healthy, but data has a dead drive–in order to cope with this, Sanoid reports the worse of the two conditions, which is the warning that data is degraded, accompanied by the identity of the degraded vdev and missing disk.
What you can’t see just from running this tool on the command line is the exit code–0 for ok, 1 for warn, 2 for crit. In very unusual cases, you could also get an exit code 3 for any untrapped error in the tools themselves.
This is an industry standard signaling technique; it’s what Nagios uses to get input from its plugins, and in fact sanoid --monitor-health is Nagios plugin-ready!
With that said, we know not everybody is itching to take on the challenge of setting up a new self-hosted monitoring server instance, whether Nagios or a competitor. That’s okay, because those exit codes work for the free service healthchecks.io also. Consider this cron job:
# send a success signal to healthchecks if monitor-health passes
5 * * * * sanoid --monitor-health && curl -fsS -m 10 --retry 5 -o /dev/null https://hc-ping.com/your-uuid-here
If you get a crit,warn, or err result, your cron job won’t fall through the && to send a “success” ping to healthchecks, and the site will alert you however you’ve gotten that configured.
Healthchecks currently offers up to 20 separate tests configured for free accounts. If you want to test more than 20 things, you’ll need a paid account. For more information on configuring Healthchecks, we recommend their own simple how-to guide.
Automated snapshot monitoring
Just as we monitored the health of the pool, we need to monitor our collection of snapshots. On a source (production) server, this ensures that snapshots are being taken–on a target (backup) server, this ensures that replication is working properly!
Essentially, this is the same process we needed in order to observe our pool health. Once we’ve listed all the snapshots, we need to figure out whether they meet our freshness standards. In other words, how old are the newest snapshots of each periodicity, on each dataset?
Once we figure out that answer, it’s time to produce an ok, warn, crit or err exit code, and a brief human-readable text output. Sanoid has you covered here, too, with sanoid --monitor-snapshots:
root@elided-prod0:/# sanoid --monitor-snapshots
OK: all monitored datasets (zroot, zroot/home, zroot/home/jim, zroot/images, zroot/images/dc0, zroot/images/fileserver, zroot/images/fileserver/D, zroot/images/qemu, zroot/images/unifi, zroot/images/win22std-gold, zroot/images/zbm, zroot/iso, zroot/ROOT, zroot/ROOT/ubuntu) have fresh snapshots
The really nice thing about letting Sanoid handle this for you, is it’s actually checking your policies on each dataset in the pool. Perhaps you’ve got a dataset named deprecated that you configured Sanoid not to take any snapshots of at all–well, that’s in the config file, so sanoid --monitor-snapshots isn’t going to complain if there aren’t any.
Here’s an example of a system with a snapshot freshness problem:
root@elided-hs0:/# sanoid --monitor-snapshots
CRIT: data/images/fio has no daily snapshots at all!, CRIT: data/images/fio has no hourly snapshots at all!, CRIT: data/images/fio has no monthly snapshots at all!
In this hotspare (backup) server, datasets and their snapshots aren’t normally created locally–they’re replicated in from the production (source) server it backs up. But in this case, the administrator created a local dataset data/images/fio to do some storage load testing.
That dataset is inside the server’s recursively defined policy for data/images–but since this is a hotspare, not a production server, Sanoid isn’t taking any snapshots of it. And since the dataset was created locally and doesn’t exist on the production server it’s backing up, that means sanoid --monitor-snapshots sees a dataset that should have an hourly less than four hours old, a daily less than two days old, and a monthly less than 5 weeks old.
This dataset failed on all three tests, so all three are present in the crit output–but since we really need to focus on what’s broken, this time we aren’t bothering to list the ok snapshots at all. (We know they’re okay, because if they weren’t, they’d show up here with either warn, crit, or even err status).
Since a single --monitor-snapshots covers the entire system, it also won’t gobble up the 20 no-cost tests you get on a free healthchecks.io account!
Monitoring free space availability
The final thing any storage administrator should be keeping an eye on is pretty simple: are we running out of drive space?
If you’re operating a FreeBSD system installed on root ZFS, with only a single pool in the system and no quotas imposed, a simple df -h / is enough to get the job done for you.
For those of us with more complex systems–such as Linux machines with non-ZFS root filesystems, or machines that have quotas imposed on individual datasets–we once again turn to a Nagios-compatible script.
Luckily, I’ve got one of those to offer you as well–this is the script I’ve used to monitor available free space on all my systems for more than a decade. Since it’s not technically ZFS related, I never added it to the Sanoid project… until today, when I cleaned it up a bit for public consumption, and added it to the project.
Fairly soon, you should get check_all_disk_space included in any Sanoid release, on any distribution. Until then, you can download it directly from the Sanoid project github.
Here’s what it looks like in action:
root@banshee:/tmp# check_all_disk_space
OK
By default, check_all_disk_spaceuses ridiculously high values for WARN and CRIT: 93% full and 98% full, respectively. If we want to see what WARN and CRIT look like, we can pass more demanding levels to check_all_disk_space directly:
root@banshee:/tmp# check_all_disk_space 0.6 0.7
OK

root@banshee:/tmp# check_all_disk_space 0.5 0.6
WARNING: /media/jim/SCARLETT: 54.3%

root@banshee:/tmp# check_all_disk_space 0.4 0.5
CRITICAL: /: 48.5%, /data/Torrents: 45.3%, /media/jim/SCARLETT: 54.3%
Although I don’t have any filesystems that are even 60 or 70% full on this workstation, once we drop the levels into the forties and fifties, we start seeing some hits.
As in our previous test tools, we’re testing the entire system at once, and returning the exit code which corresponds to the worst condition we found. We see this in action in our last test: although SCARLETT is only in warning condition, root and Torrents are both now critical, so critical is the blanket exit code (and description) we receive.
And once again, we can either call this as a Nagios-compatible plugin, or we can build a healthchecks service and add a line to our crontab to ping it each time we receive an OK condition.
Conclusions
That about wraps it up for today’s short lesson in OpenZFS monitoring and observabililty. Our key takeaway points for the conscientious administrator:
- Take regular snapshots
- Monitor pool health regularly
- Monitor snapshot freshness regularly
- Monitor free space available regularly
Although these tasks are simple to describe, there’s a surprising amount of logic necessary to properly implement them. If you write your own tools for this, please be prepared to spend serious time and effort on them–the stakes are high, here, this is your precious data!
But instead of writing your own tools, we recommend picking up something battle-tested and configurable, that can handle it for you. I recommend Sanoid, as it makes all four of these tasks dead simple, integrates directly with Nagios, and works well in conjunction with healthchecks.io for those who aren’t in the mood to set up an entire monitoring server instance.
For organizations running OpenZFS in production, monitoring and measuring data is only useful if it leads to correct conclusions and effective remediation. Klara offers a ZFS Performance Audit service focused on assisting with pool layouts, workload behavior, caching, snapshot policies, and monitoring outputs to identify risks and performance bottlenecks. This service helps operators validate that their ZFS systems are behaving as optimally as possible and correct issues before they become outages or data loss events.