


There comes a time in every storage admin’s career where they realize that they have built an excellent system–but the details of it have gotten a bit away from them, and they’d like more insight into what they’re managing.
Tools for Identifying and Resolving Storage Bottlenecks
Today, we’re going to talk about several tools that can make basic storage analysis easy under either FreeBSD or Linux. In a nutshell, one can use the tool iostat to get very low-level information on each individual physical storage device in a system, while the tools zpool iostat, ztop, and ioztat each offer additional OpenZFS-specific metrics.
Using these tools, a storage admin can easily discover storage bottlenecks and potential reliability issues–want to know if a disk is slowing your pool down? Check zpool iostat! Want to know which of ten virtual machines is eating all of your storage performance? Try ioztat instead!
Each tool we’re covering is available on both FreeBSD and Linux systems. Iostat and zpool iostat are also available on Illumos and Oracle systems, though the arguments may differ somewhat.
iostat: A Core Tool for Low-Level Storage Analysis
iostat is the only tool we’re talking about today which is not ZFS-specific. This venerable system analysis tool used to be a part of most distributions’ base systems–and it’s still a part of FreeBSD base, although more consumer-focused Linux distributions tend not to install it by default anymore. (Under Ubuntu, it can be found as part of the sysstat package in the main repository.)
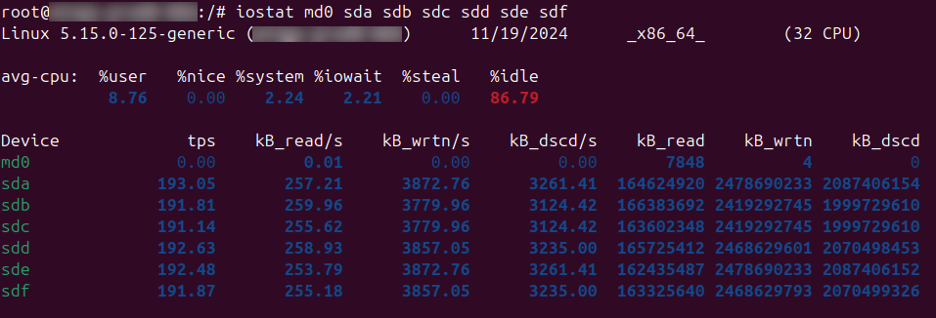
Although it’s not the easiest tool to use, iostat reports extremely granular information about each of your physical storage devices’ statistics. By default, as shown above, iostat reports all activity on each device since the last system boot.
More interestingly, if invoked with a trailing numeric argument n, iostat will display the same table summarizing activity on each device during the last n second interval, batch-printing each table sequentially as time goes by.
Using iostat to Identify Storage Bottlenecks
By default, iostat displays KiB read, written, or discarded–both as the average per second over the last interval n, and as the total during the last interval n. One can get access to more statistics with iostat -x–most interestingly, including the %util column, which tells you how much of a storage device’s time was idle during the reporting interval.
Although iostat doesn’t know anything about ZFS–or any other filesystem–it remains one of the most useful tools available for low-level troubleshooting of storage device performance and identifying storage bottlenecks. It can also be used as a “canary” to warn you if a drive is about to fail, helping system administrators prevent critical failures caused by storage bottlenecks.
Using Extended Statistics for Deeper Insights
Let’s take another look at the same system, this time using the arguments -x for extended statistics, and -s for short (<80 column) output:
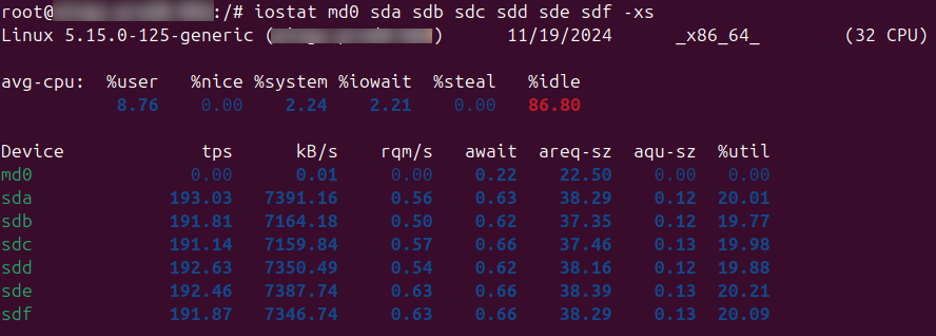
This time, we get the additional column %util. This column tells us what percentage of a storage device’s time is spent idle. If you have several drives in the same array, as the above system does, you should expect most of those drives’ stats to be roughly similar, as seen above.
On the other hand, let’s say /dev/sdf above showed a %util of 60. If its sibling drives in the same array only showed 20 apiece, that would indicate a problem. Most likely, /dev/sdf is spending a lot of time retrying operations before getting a valid result. This, in turn, would suggest that we should replace /dev/sdf before it fails outright!
For more on iostat, see Klara’s 2021 article FreeBSD iostat–A Quick Glance. The rest of the tools we’ll be talking about are ZFS-specific. While they don’t offer the per-device functionality that iostat does, they offer additional information that iostat can’t.
zpool iostat: Simplified Storage Insights for ZFS Pools
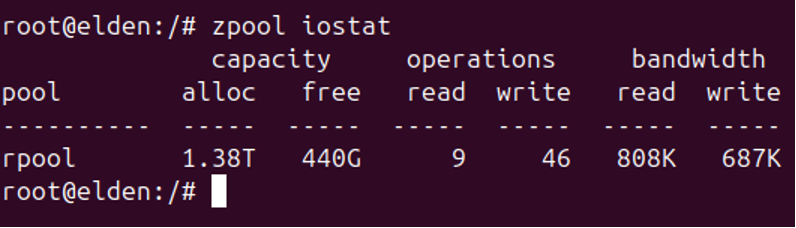
Invoked without arguments, zpool iostat produces perhaps the simplest output of all the tools we’ll view. In a nutshell, zpool iostat offers roughly the same information that iostat does. Instead of offering it for each individual physical storage device in a system, zpool iostat offers that data as applicable to each ZFS pool on that system.
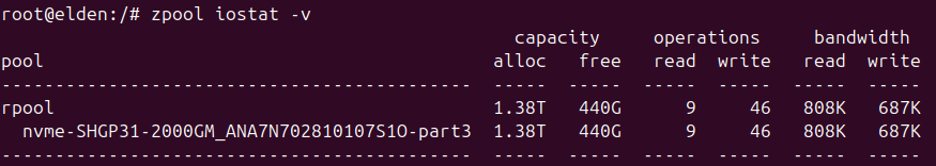
While zpool iostat doesn’t provide the same level of per-device granularity as the vanilla iostat, you can still view per-vdev statistics for a zpool by invoking zpool iostat -v:
For the most part, we’d recommend using “real” iostat to inspect individual drive metrics, especially when investigating storage bottlenecks, even on an OpenZFS system. The ZFS-centric organization of data on zpool iostat is a strong advantage. There’s no practical way to reassemble vanilla iostat’s output to display activity at a per-pool or per-vdev level. If your focus is higher up the stack than the raw physical hardware, zpool iostat remains the recommended tool.
Just like “real” iostat, zpool iostat reports all activity since the system was booted by default, with arguments available to instead create scrolling reports each n seconds.
For considerably more about zpool iostat, check out Klara’s 2020 article, Using zpool iostat to monitor pool performance and health.
Detailed Latency Metrics with zpool iostat Histograms
So far, we’ve leaned toward iostat’s more detailed and lower-level metrics, dismissing zpool iostat’s simpler output. However, zpool iostat has a feature that many administrators haven’t discovered—and we didn’t cover in our 2020 article—a built-in histogram, accessible with the -w argument.
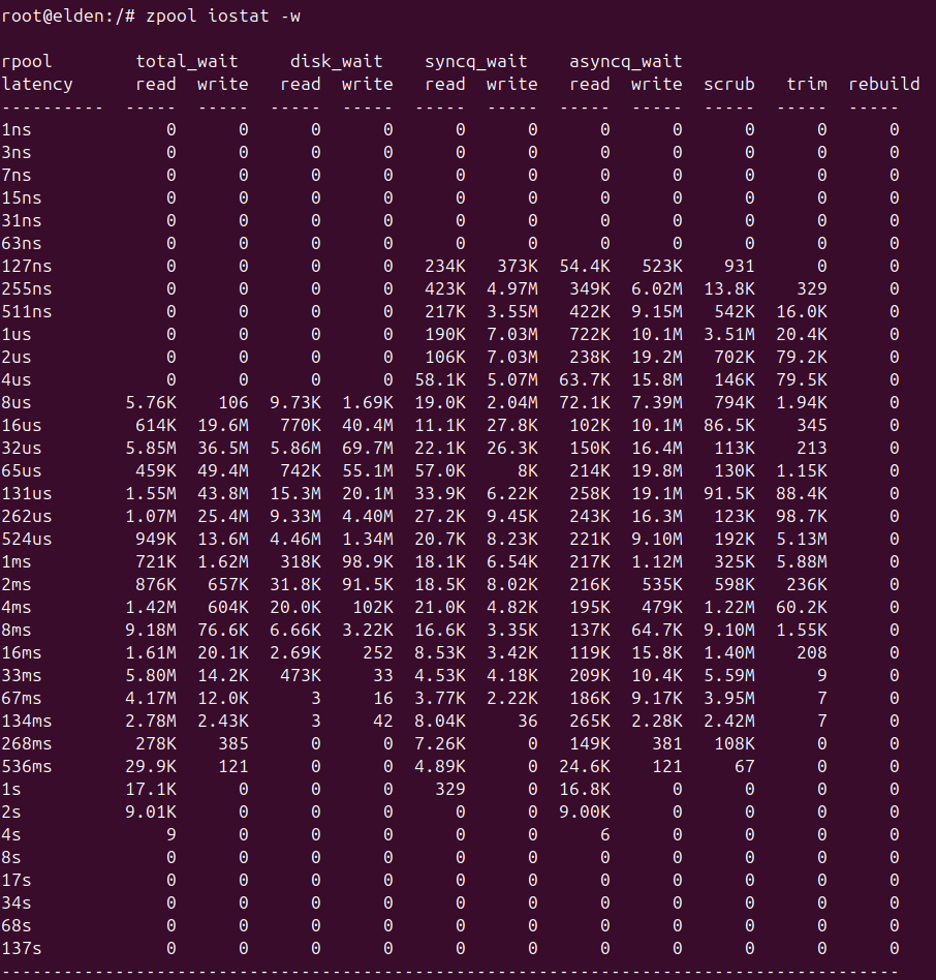
In the above screenshot, we can see a table showing the amount of data of various types (in columns) which was serviced within a given maximum timeframe (in rows). This is a very, very granular breakdown of latency experienced on the system. It can also be a tool used to pinpoint storage bottlenecks on the system.
For example, the leftmost column is total_wait (read), which refers to the service interval required to complete read operations. The largest value in that column is 9.18M, visible in the 8ms row. This indicates that, since the system was last booted, approximately 9.18 million read requests were serviced with a total wait time of roughly 8ms each.
Understanding Read and Write Queues
You might be wondering why I said the system completed “about” 9.18 million read operations. As it turns out, the unit scaling for zpool iostat is powers-of-two, not metric. So technically, that’s 9.18 “MebiReads”--9.18 * 1024 * 1024, not 9.18 * 1000 * 1000.
(You can confirm this on your own system by running zpool iostat -w and zpool iostat -wp in quick succession, and comparing the raw numbers to the unit-scaled numbers.)
We also see individual read and write columns for disk_wait, syncq_wait, and asyncq_wait. Disk_wait is the amount of time required waiting for actual hardware to complete an operation. Syncq_wait is the time an operation spends in synchronous I/O queues, and asyncq_wait–shockingly!--is the time an operation spends in asynchronous queues.
Finally, we see columns for scrub, trim, and rebuild. These will be zero on many systems at most times, but will let us know metrics for any scrub, trim, or resilver operations that occurred during the monitored period.
Interpreting zpool iostat histograms
In the previous section, we noted that this system’s largest value in the total_wait (read) column is 9.18M at 8ms. That represents 9.18 read “MebiOperations” completed since boot time. Moving one column right, we see the largest value for total_wait (write) at the 65 microsecond row.
By now, it should be clear that this means ~9.18 million read operations completed in ~8ms each, and ~94.4 million write operations completed in ~65 μs each. What conclusions can we draw from this histogram?
Since this system’s largest total_wait (read) cell is 9.18M at 8 milliseconds, and its largest total_wait (write) cell is 49.4M at 65 microseconds, we can conclude that it has performed significantly more write operations than read operations since its last boot. We can also conclude that it tended to complete write operations more quickly than reads.
Although this is not a completely scientific conclusion so far–it only looks at the largest value in each column, rather than adding all rows together and finding average and median values–it does correspond with reality. Since boot, this system has run several very write-heavy fio tests, which both artificially pumped up the total number of writes it has performed, and tended to significantly delay reads (both related and unrelated) while those tests were running.
Much like iostat itself, this tool has so many applications that it’s hard to define “what it’s for.” If you’re already imagining the possibilities, it might be a sign that a career as a storage or system administrator is worth exploring—you’ve got the right mindset!
Installing zpool iostat
Unlike the other tools on this list, there’s no need to install zpool iostat separately–it’s built directly into OpenZFS itself, as of the now-ancient 0.8 release.
ztop
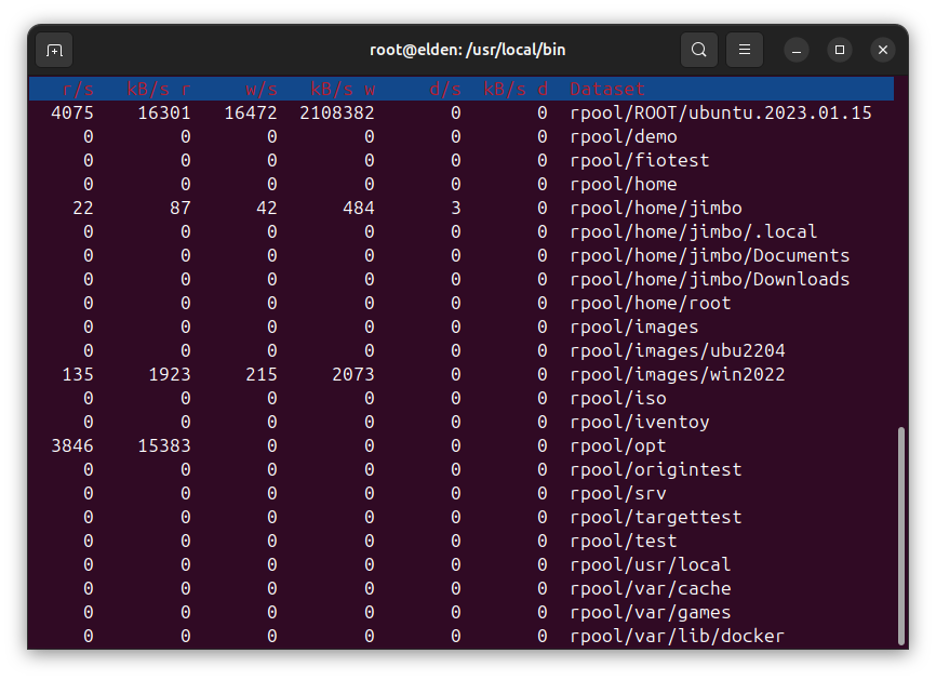
Ztop is a simple and useful tool that shows you how busy each of the datasets in your pool is at the moment. Ztop supports both command line arguments and in-application interactive commands which reorganize and/or filter its output; when run without arguments, you simply see a list of all datasets on your system and their individual activity levels, as seen above.
Before taking this screenshot, I fired up a Windows Server 2022 VM–whose backing image is at rpool/images/win2022–and ran a rate-limited fio test in the root of my host system. The game platform Steam is also running, although I didn’t specifically stage that part for the screenshot!
For each dataset in my pool–or as many as fit in a single screen, at any rate–we can see columns for read and write operations per second (r/s and w/s), and read and write throughput per second in KiBibytes (kB/s r and kB/s w).
We also see two curious and undocumented columns labeled “d/s” and “kB/s d.” These are probably intended to represent deletions the same way that reads and writes are, but that’s not quite correct–what they actually track are the kstat properties nunlinks and nunlinked, which respectively are deletion requests in queue, and deletion requests completed:
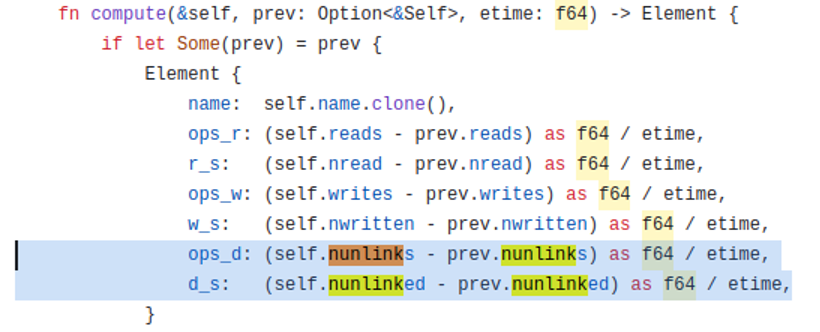
We’ve filed a bug report at the project’s GitHub; in the meantime, we’d advise most folks just ignore those two columns entirely.
Installing ztop
If you’re a FreeBSD user, you should be able to install ztop directly from the main FreeBSD repository, using the command pkg install ztop.
If you’re a Linux user, odds are that ztop won’t be in your repositories. You’ll need to build it yourself–a task which the official Github repository won’t give you any hints about. Instead, we’d recommend using the Cargo system. This is a package system built into the Rust language itself–something like Perl’s CPAN, for those of you versed in that language.
In Ubuntu, the necessary steps are sudo apt install cargo followed by sudo cargo install ztop –from there, the cargo system downloads the ztop “crate” for you, then builds and installs it. It will warn you that it deposited the binary into /root/.cargo/bin/ and suggest that you add that folder to your PATH; instead, I copied the binary into my PATH using cp /root/.cargo/bin/ztop /usr/local/bin/.
Another minor hurdle on Ubuntu is that you don’t get a manpage with your Cargo build. You can find the man page source on the project’s Github, and if you’re sufficiently enterprising, add that source to your system so that man ztop works. Alternatively, you can do what I did, and just find a hosted man page online.
Absent that, you can get most of the documentation available by invoking ztop --help. Good enough!
Ioztat: Flexible Alternative for Dataset-Level Monitoring
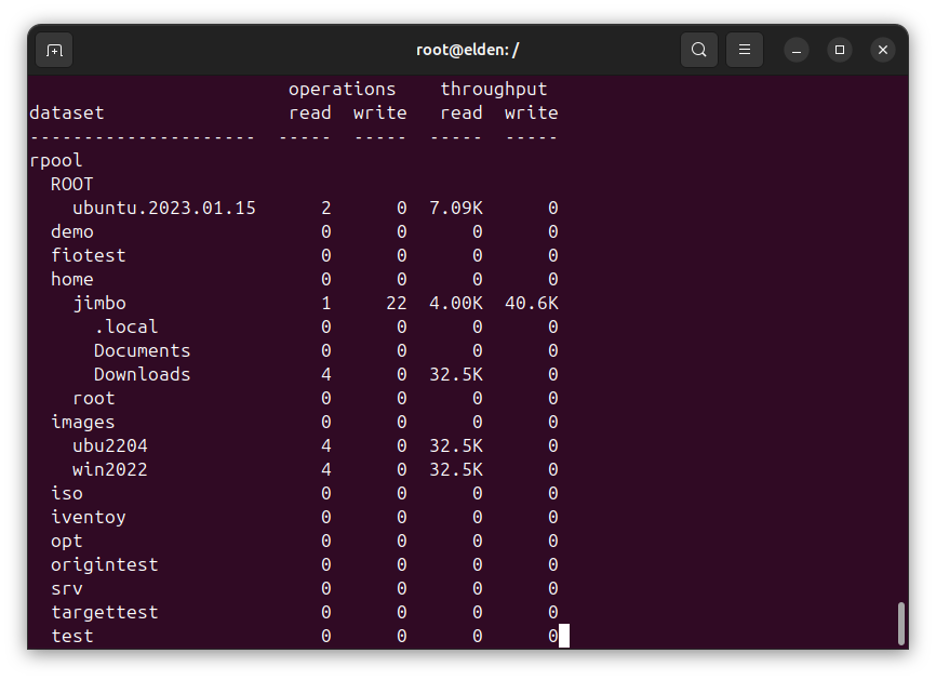
Ioztat is another tool for monitoring your OpenZFS pool’s activity on a per-dataset level, and it uses kstat information in much the same way that ztop does.
For the most part, these tools display the same information in roughly similar ways. The important difference is that ztop mimics the top command in its output format, arguments, and interactive features. In contrast, ioztat is designed to more closely resemble the iostat command and its ZFS counterpart, zpool iostat.
Invoked without arguments, ioztat performs much as the standard iostat tool does–it spits out a single table showing you a summary of all activity for each mounted dataset since the most recent system boot, then exits.
If invoked with a trailing numeric argument n, you instead get a series of reports on activity each n seconds, with each report only displaying activity during that interval. By default, these fresh reports print in series, suitable for redirecting to a log file for later analysis. However, if you also specify the -o argument, you instead get the same data in a continually refreshing, screen-friendly format much like ztop’s.
Ioztat also supports quite a few (mostly iostat-like) arguments which allow you to more carefully filter which datasets are or not displayed, whether to show child dataset activity in their parent datasets’ rows, and more. This flexibility makes it particularly useful for diagnosing storage bottlenecks and optimizing ZFS performance.
Installing ioztat
To the best of my knowledge, ioztat hasn’t made it into anyone’s official repositories yet–but it’s a simple Python3 script with no special requirements. As long as your system has a working Python3 interpreter, you can simply download the script directly from its project page. Then, place it wherever in your PATH makes sense–typically, I’d recommend /usr/local/bin.
Conclusion
Although most users will never need to use these tools, professional admins might. Those with a mindset to dig deep and truly understand how their systems work can use one or more of these tools. They can address almost any performance query and resolve storage bottlenecks effectively.
At Klara, we specialize in OpenZFS and FreeBSD solutions, helping businesses optimize storage performance and resolve bottlenecks efficiently. Whether you need expert guidance, custom development, or proactive support, our team is here to help you get the most out of your storage systems.